Penny Wise Pound Foolish: Power BI

Welcome to “Penny Wise, Pound Foolish,” a series where we’re going to talk about things we do in manufacturing that save a little bit of money in the short term… and cost us a lot on the backend.
Today we’re going to talk about Power BI, and to an extent all Business Intelligence tools. Now, I know what you’re saying “Dave, we don’t need any of this new fangled Business Intelligence”.
Hear me out.
Business Intelligence is not something trying to take your jobs. It’s something that, if used properly, can make your job easier, allow you to make decisions faster, and make everything run smoother. I can even do impossible miraculous things like make the boss happy.
Want to hear the best part? You’re probably already paying for it.
That’s right, if you’ve got an O-365 subscription from Microsoft, you’ve already got Power BI included.
What Were We Using Before?
Business Intelligence and data analytics, like many things in our industry, have taken a technological journey in the past few decades. Also like other aspects of the manufacturing industry, many people are still using outdated tools and methods of yesteryear, simply because they don’t want to make a change. These old ways and old tools include lots of things, starting out with pen and paper. Then we get into more basic tech solutions, like computer screen print outs. Beyond that is potentially A LOT of complex and tedious Excel work, or maybe even something like an Access database.
All of these were once the “best solution.” All of these had their time and place. . . but that time and place is long gone. In 2020 and beyond, all these basic solutions are poor tools for the job at hand.
Pen and paper data analytics means going back and forth from your calculations to the meeting room, generally over multiple weeks, and potentially losing the ability to fix the problem before it gets worse. Excel is a great tool that many are familiar with, but it’s not the most powerful tool, nor can it connect and pull from the databases in a way that is efficient. You have to be a super power user to be able to get Excel to answer the questions you need. As for databases, they have a set lifespan. Once the person who built the database has moved on, no one will know how it works or how to maintain it.
What Can We Do
Using Power BI, we can easily visualize the data by connecting the databases that you currently have, including time-series data from solutions like OSIsoft PI, Rockwell Historian, and Wonderware solutions.
Then it’s even easier to build dashboards and ask questions. Yes, you can communicate with Power BI using Natural Language queries. Type a question. Get an answer. Welcome to the future.
Build It Once, Use It Forever
Build it once, set up refresh rates, put it on screen, and you’re in business.
Take a look at the dashboard below. Jim Gavigan, Power BI wizard, created this because he didn’t like how the website data was looking in Google Analytics. So he quickly pulled the information in and built these dashboards to refresh every 2 hours.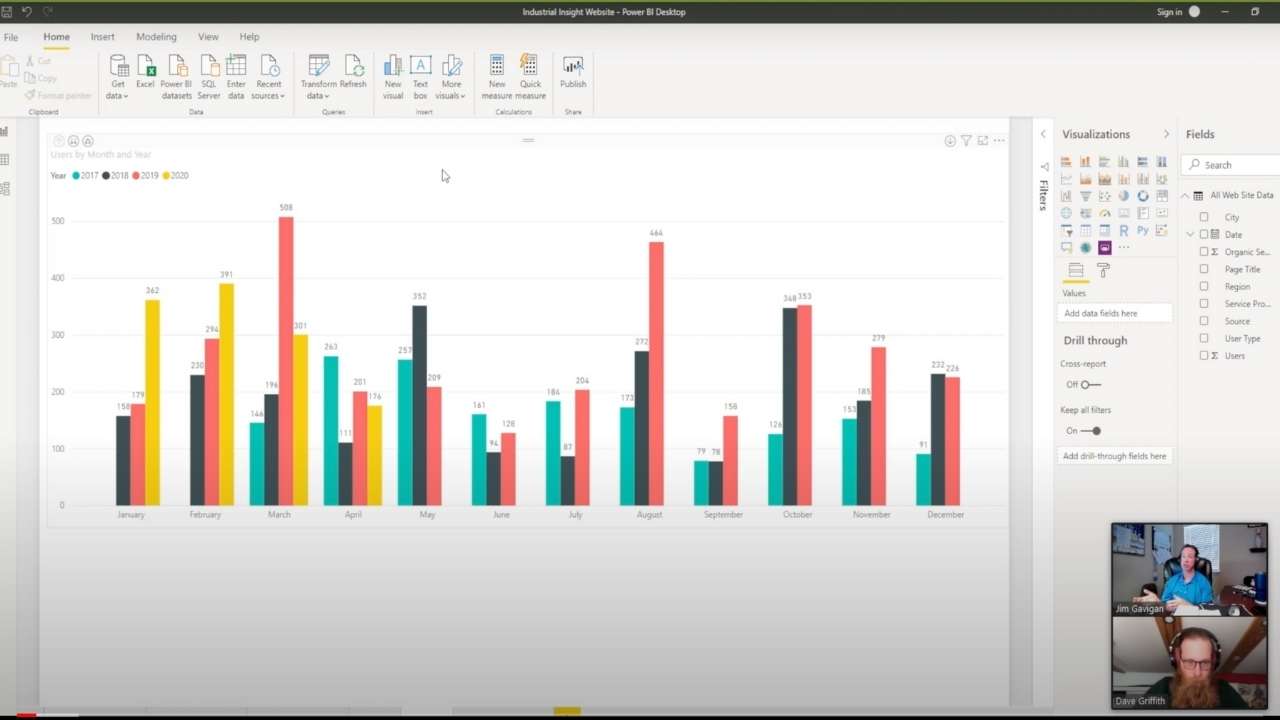
Now imagine this as your manufacturing data, displayed on large screens in your conference rooms. Now you have a real time display showing the rates that you ship product, as well as how those numbers compare to last month and last year. That is some exceptionally powerful data.
I invite you to dig further into Power BI. Check out how you can use it for Time Series Data (or any data for that matter). See how quickly and easily you can build dashboards, ask Natural Language questions, and more.
For more about that, please check out the series Jim Gavigan and I did “Power BI for Dummies – Time Series Data.”
If you’re interested in reading more about “Data” please let me know. As many of you know I’ve been talking about it for years and would be happy to write more about this!
Beyond that, if you’re looking for something else to read, please check out the RE-Shoring blog series.